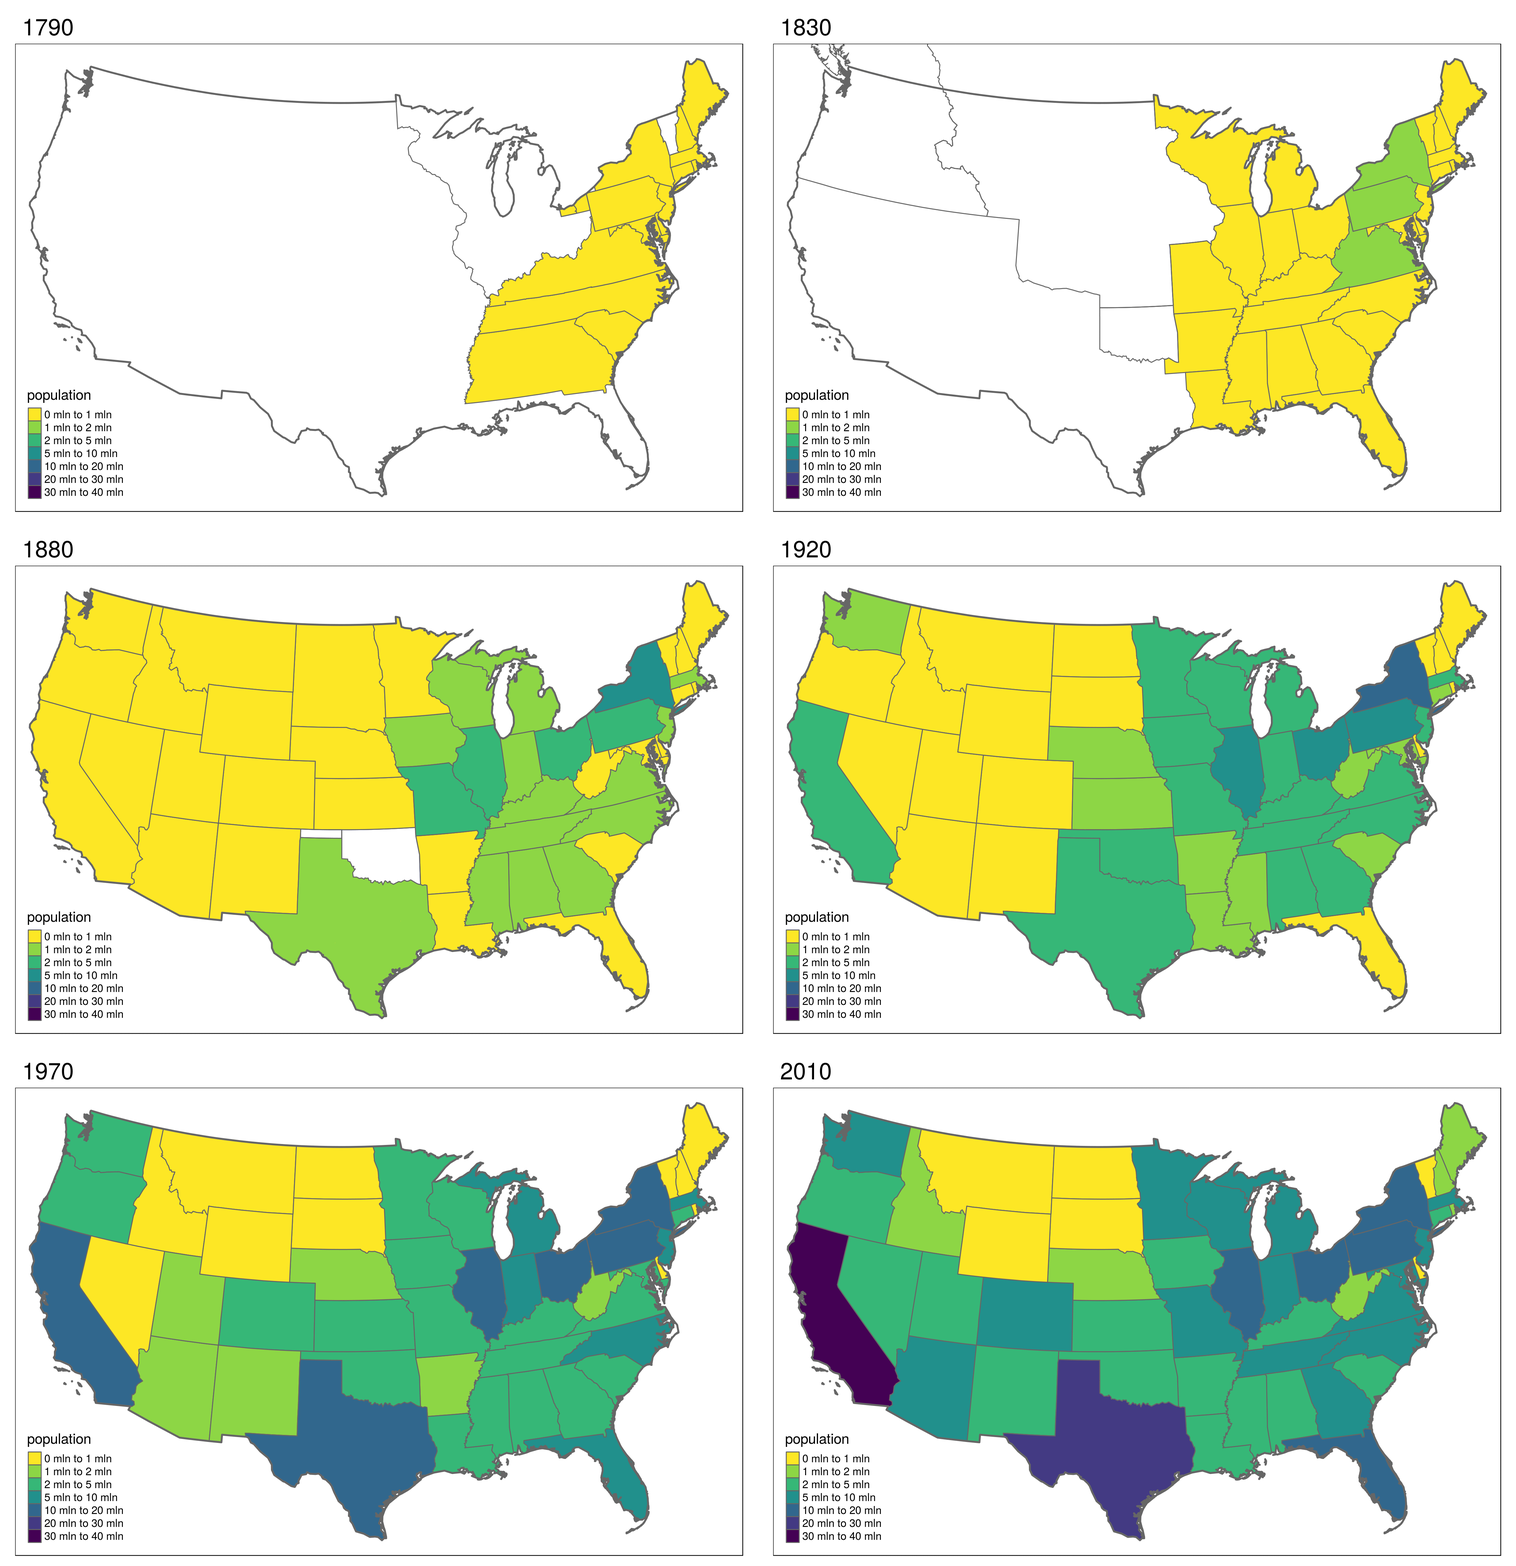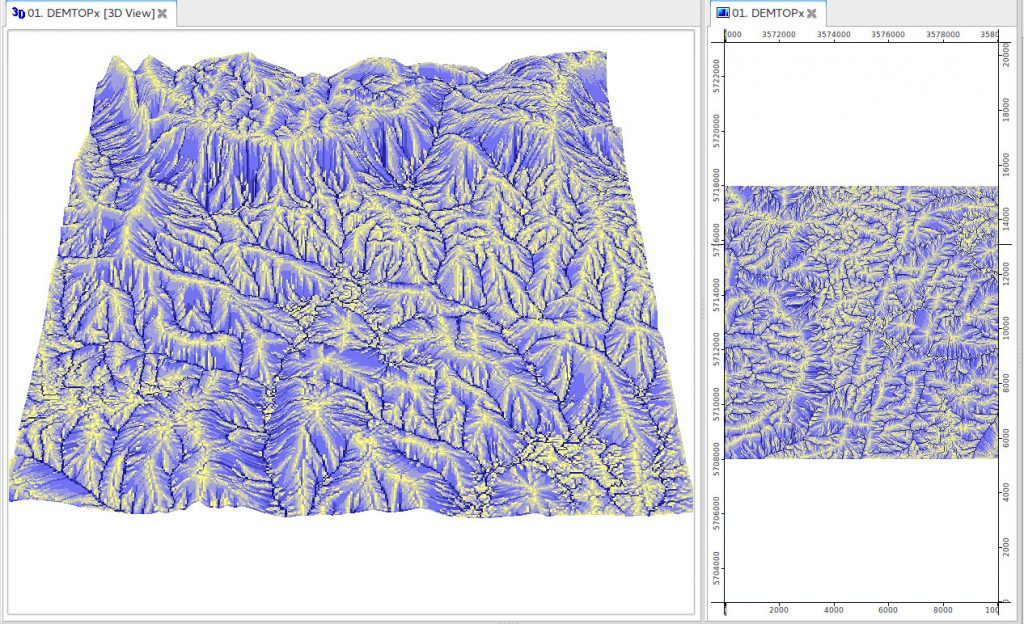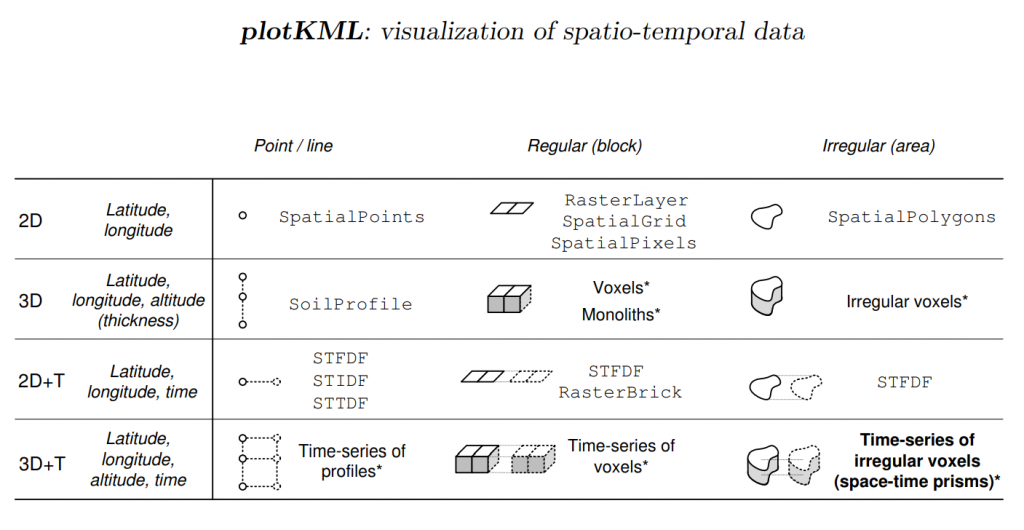
To be able to use spatial data and make decisions based on it, we need to be able to visualize it (statically, interactively, through web etc). The following lessons explain how to visualize spatial data using R packages.
References:
- https://github.com/r-spatial/
COURSE FEATURES
Video lessons
LESSONS
Introduction to mapview and mapedit
Using mapview and mapedit to visualise and edit geo-spatial data interactively in R
Post Views: 1,413


