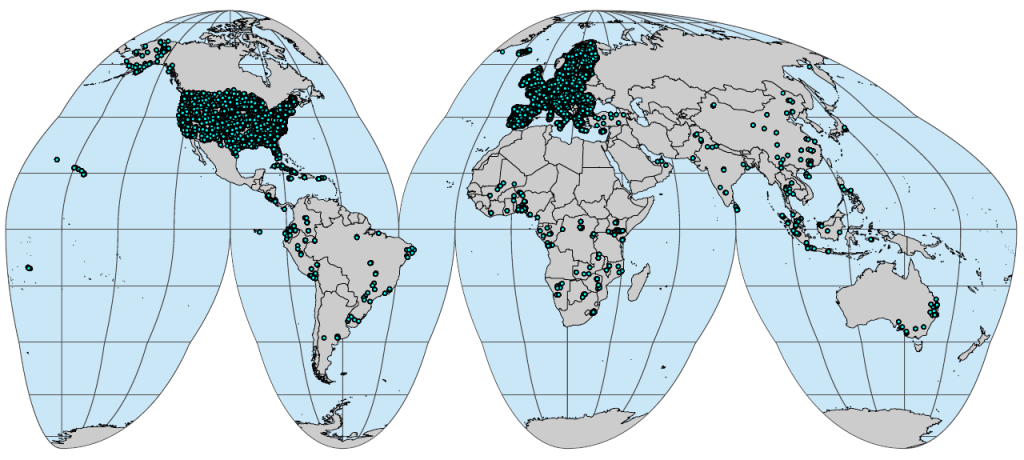
The NASA / USGS Landsat Program is the longest running initiative to provide space-based data for Earth’s land surface. Based on nine satellites, this program has been monitoring the planet since 1972, consistently providing multispectral images for several applications.

Due to technology differences among the satellites / image sensors (spectral and radiometric differences), there are significant variations in the values obtained by each satellite for the same area in Earth’s surface, which reduces the applicability of long-term time series analysis and spacetime Machine Learning approaches.
Seeking to solve this issue, Global Land Analysis and Discovery (GLAD) from University of Maryland (UMD) created a harmonized analysis-ready landsat collection (Landsat ARD) for the entire planet covering a multidecadal span of years (1997–2022+). Described in detail in Potapov et al., 2020, it is a fundamental dataset for long-term monitoring of forests, croplands, snow, population dynamics, and other environmental variables at global scale.
During the GeoHarmonizer project (grant agreement ID 2018-EU-IA-0095), OpenGeoHub used it to produce analysis-ready and cloud-optimized (ARCO) European-wide mosaics from 2000 onwards, implementing an automated workflow for:
- Downloading 16-day composites directly to RAM for 1,149 tiles (4004 x 4004 pixels),
- Masking clouds and clouds shadow according to Quality Assessment (QA) band,
- Aggregating all images of a year in quarterly composites by temporal percentiles (25th, 50th and 75th),
- Gapfilling all the time serie (2000–2020) using a median interpolation based on temporal neighborhoods,
- Reprojecting all images to ETRS89-extended / LAEA Europe (EPSG:3035),
- Producing European-wide mosaics in Byte format (the original data is in UInt16) and Cloud-Optimized GeoTIFF (COG).
The final mosaics (7 bands x 3 percentiles x 84 dates) resulted in about 8 TB of data and are publicly available in EcoDataCube through web viewer (http://ecodatacube.eu) and SpatioTemporal Asset Catalog (STAC – http://stac.ecodatacube.eu). A detailed description of the processing workflow can be found in Martijn et al., 2022 (pre-printing).

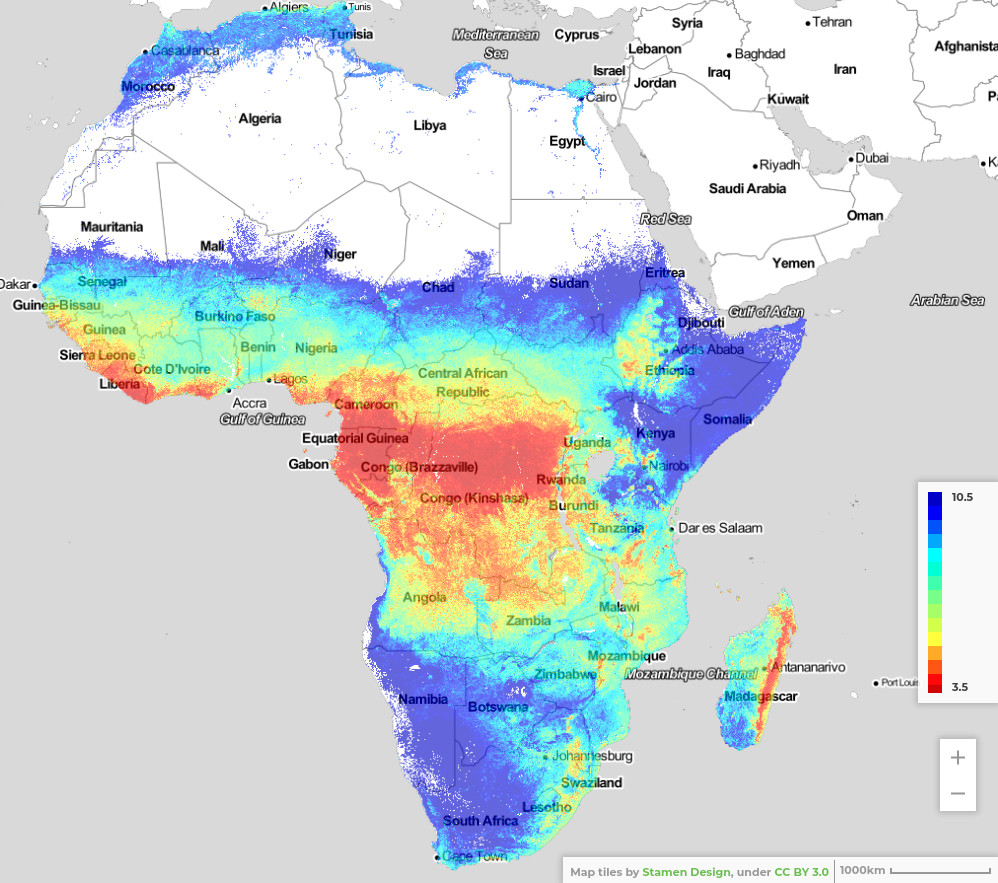
Since last year, OpenGeoHub has been working together with World Resources Institute (WRI) and GLAD, in the context of Land & Carbon Lab, to expand this workflow for the entire planet. They believe that this approach can improve the accessibility of the Landsat data for projects that only require bi- / tri-monthly aggregated values and less numeric precision, serving global ARCO mosaics in Byte format for multiple research organizations. This is a common procedure with MODIS land products, where, for example, 8-day products are aggregated to produce monthly products, which are then 3–4 times smaller in size.
The foundation demonstrated how such data can be efficiently reduced / compressed and seamlessly used for vegetation and land cover mapping in the follow publications:
- Witjes M, Parente L, van Diemen CJ, Hengl T, Landa M, Brodský L, Halounova L, Križan J, Antonić L, Ilie CM, Craciunescu V, Kilibarda M, Antonijević O, Glušica L. 2022. A spatiotemporal ensemble machine learning framework for generating land use/land cover time-series maps for Europe (2000–2019) based on LUCAS, CORINE and GLAD Landsat. PeerJ 10:e13573 https://doi.org/10.7717/peerj.13573.
- Bonannella C, Hengl T, Heisig J, Parente L, Wright MN, Herold M, de Bruin S. 2022. Forest tree species distribution for Europe 2000–2020: mapping potential and realized distributions using spatiotemporal machine learning. PeerJ 10:e13728 https://doi.org/10.7717/peerj.13728.

Currently, their major limitation is the network bandwidth to move the Landsat ARD archive from the U.S. to Europe (it took more than 40 days to download all the images for Europe from 2000 to 2020). To overcome it, they decided to create an offline copy of the entire archive (more than 1.3 PB) using several hard disk drives (HDD), that are being shipped to Europe. This data was completely reprocessed by the GLAD team to take advantage of improvements implemented by USGS in Landsat Collection 2.
Primarily, OpenGeoHub will use this data to develop a global grassland monitoring system, producing recurrent and high-resolution (30-meter) maps for pasture areas and productivity from 2000 onwards. All the global ARCO mosaics and maps will be publicly accessible through STAC as Open Data (CC-BY), and will be useful for other projects like Open-Earth-Monitor Cyberinfrastructure (grant agreement ID 101059548) and AI4SoilHealth, both funded by Horizon Europe programme.


